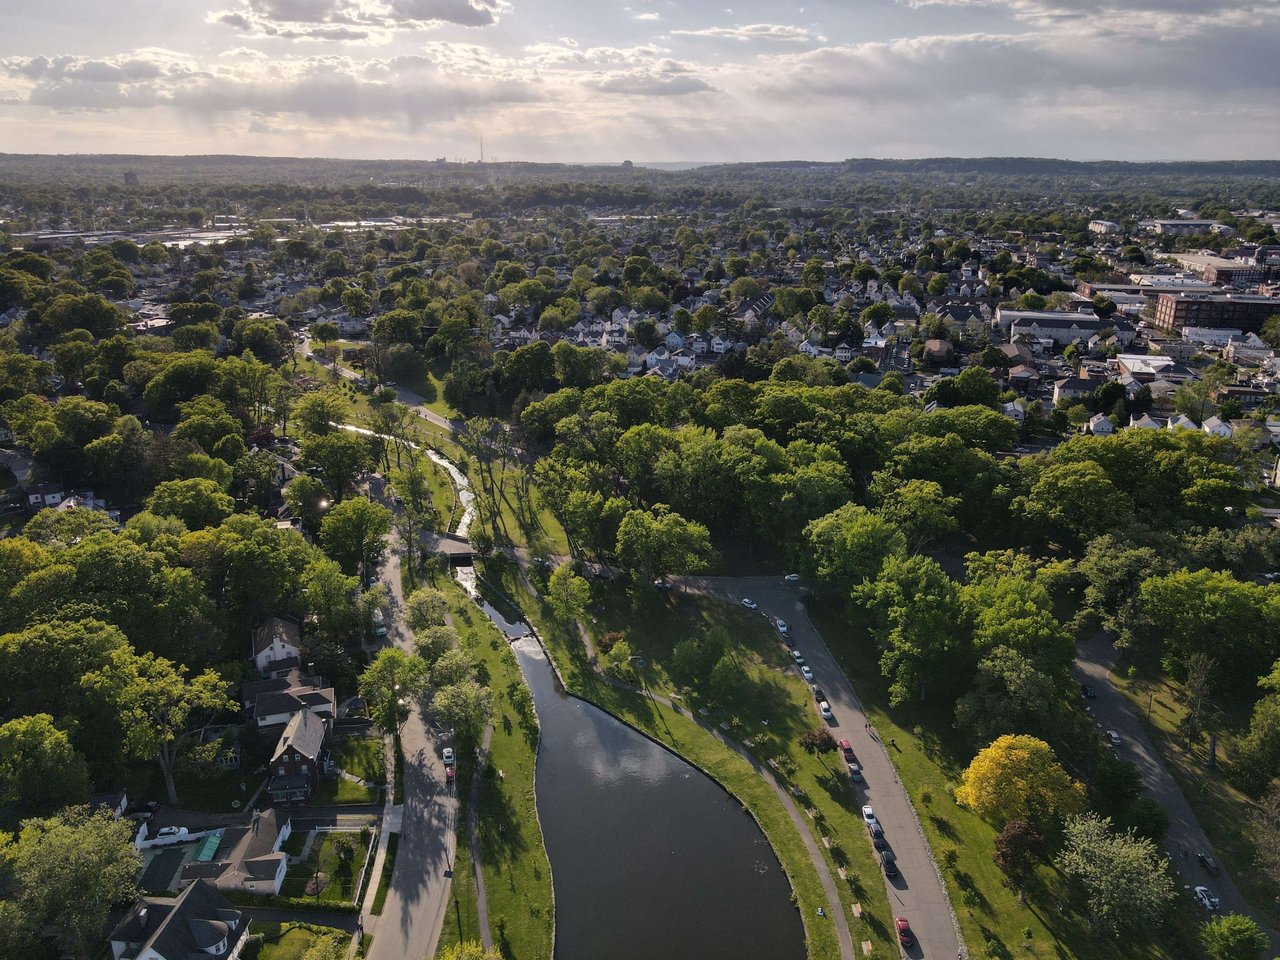
Clifton Park, NY Real Estate Market Update: July 2026
If you're thinking about buying, selling, or just keeping tabs on your equity in Clifton Park, here's where things stand heading into late summer 2026.
Home Prices Are Still Climbing, Just More Gently
Clifton Park remains one of the pricier corners of Saratoga County, and values are still trending up rather than flattening out. A few data points paint the picture:
- Across the broader Clifton Park market, the median list price in July 2026 sat around $599,000, with homes averaging about $264 per square foot.
- Looking specifically at closed sales, the median sale price in May 2026 was $515,192, up 2.4% from a year earlier.
- In the 12065 zip code specifically, the typical Zillow-estimated home value is closer to $409,649, up 3.8% year-over-year — a reminder that Clifton Park spans a wide range of neighborhoods and price points, from starter Colonials to new luxury construction.
- Zooming out to Saratoga County as a whole, the average home value is $465,901, up 5.4% over the past year.
The takeaway: whichever number you look at, appreciation is still positive, but it's the kind of steady, mid-single-digit growth you'd expect from a mature, in-demand suburb rather than the sharper spikes of a few years ago.
Homes Are Moving Fast — But Inventory Is a Little Looser Than Peak Pandemic Years
Homes in Clifton Park are still selling briskly. The median time on market in July 2026 was about 18 days, essentially unchanged from July 2025. That's a fast pace by national standards, and it signals continued strong buyer demand, especially for well-priced, move-in-ready homes.
That said, buyers finally have a bit more to choose from than in the tightest years of the market. Active inventory has been running in the 140–150 home range at any given time — enough to give serious buyers real options without eliminating the competitive pressure that keeps good listings under contract quickly.
What's Driving Demand
A few factors continue to make Clifton Park attractive:
- Schools. The town is served primarily by the well-regarded Shenendehowa Central School District, along with parts of Burnt Hills–Ballston Lake and Niskayuna — a perennial draw for families relocating to the Capital Region.
- Location. Sitting just off Exit 10 of the Northway (I-87), Clifton Park offers an easy commute into Albany, Schenectady, and Saratoga Springs, while still feeling like a quieter, tree-lined suburb.
- New construction activity. Builders are actively adding inventory at the higher end of the market, including luxury communities like Edgewood Estates and new-build neighborhoods such as Juniper Ridge, giving buyers move-in-ready options beyond the resale market.
- Lifestyle amenities. Access to the Mohawk River, Vischer Ferry Nature & Historic Preserve, and Clifton Common continue to appeal to buyers looking for green space without sacrificing convenience.
What This Means If You're Buying
With homes still selling in under three weeks on average, buyers should come prepared — pre-approval in hand, ready to move quickly on well-priced listings. That said, the modest uptick in inventory means you're less likely to be one of a dozen competing offers than you might have been a couple of years ago, particularly outside the most sought-after streets and price bands.
What This Means If You're Selling
Sellers are still largely in a favorable position. Fast sale times and continued (if moderating) price appreciation mean well-prepared homes — priced realistically and presented well — are still finding buyers quickly. The caveat: with slightly more competition on the market than in recent years, pricing strategy and presentation matter more than they did when almost anything sold within days regardless of condition.
Bottom Line
Clifton Park's housing market in mid-2026 looks healthy and balanced rather than frenzied: prices are up modestly, homes are still selling quickly, and inventory is giving buyers a little breathing room. It remains a strong, stable market for both buyers and sellers, anchored by good schools, easy highway access, and steady demand.
Market data referenced above comes from Redfin, Zillow, and Movoto as of July 2026. Real estate data can shift month to month and vary by source and methodology, so if you're making a specific buying or selling decision, it's worth talking to a local agent for the most current, hyperlocal numbers.